Guys,
As you know, each year I do an auction report card and this year is no exception (as I write this I’m about halfway through the grading). Last year as part of that I introduced the team depth charts, where I estimate each team’s Wins Above Replacement (or WAR) using the methodology I developed a few years back. The goal was to better refine the report card’s predicted standings, and as you’ll see in this year’s report card the WAR system did quite well last year in predicting things. Below is an example of what the depth charts look like; this is my team from last year (that rotation… oh the humanity!):
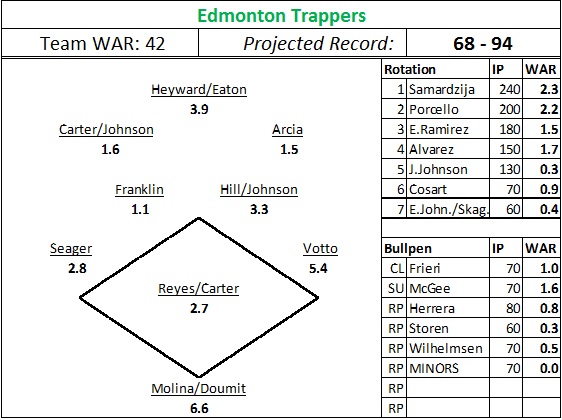
Anyway, just like last year I’m asking for a little help from you guys. Basically, to come up with the depth charts I need the following, either from you guys (ideal, for accuracy) or from my own estimations (not as accurate and more work for me):
- Projected starting rotation (and #6/7 starters if you have any guys with poor durability)
- Projected closer AND primary setup man (they both get a WAR boost from pitching in high leverage/important spots)
- Rest of bullpen
- Starting lineup, including platoons (ideally you’d give a batting order vs LH and RH since the amount of plate appearances is different whether you’re hitting 1st or 9th)
- Any defensive replacements you plan to use a bunch, and who you may plan to use to fill in in the case of long term injury (ie for F rated guys)
So if you’re inclined to, send me an email with the info (or comment here) but only do so once you’re sure that your 25 man roster is set (ie if you’re planning to make trades or still need to draft someone from the minors draft that will fill a key role, hold off until a bit later in the week).
Thanks!
Mike
